The figure drawn below gives the velocity graphs of two vehicles A and B
The figure drawn below gives the velocity graphs of two vehicles A and B. The straight line OKP represents the velocity of vehicle A at any instant, whereas the horizontal straight line CKD represents the velocity of vehicle B at any instant. In the figure, D is the point where perpendicular from P meets the horizontal line CKD such that PD = ½ LD:
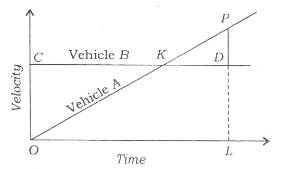
What is the ratio between the distances covered by vehicles A and B in the time interval OL?
- 1 : 2
- 2 : 3
- 3 : 4
- 1 : 1
Answer
Distance = Velocity × Time
So, the area under velocity-time graph gives the distance. In the time interval OL,
Distance covered by vehicle B = area of rectangle COLD = OL × LD
Distance covered by vehicle A = area of triangle POL = ½ OL × PL
= ½ OL × (PD + LD)
= ½ OL × (½LD + LD)
= 3/4 OL × LD
The correct option is C.