Answer the questions on the basis of the following two charts
Answer the questions on the basis of the following two charts.
Note: Availability is defined as production less export.

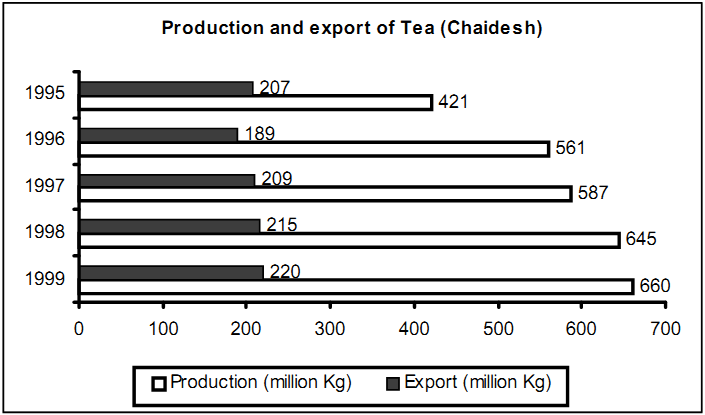
1. In which year during the period 1996-1999 was Chaidesh’s export of tea, as a proportion of tea produced, the highest?
- 1996
- 1997
- 1998
- 1999
2. In which of the following years was the population of Chaidesh the lowest?
- 1995
- 1996
- 1997
- 1999
3. The area under tea cultivation continuously decreased in all four years from 1996 to 1999, by 10%, 7%, 4%, and 1%, respectively. In which year was tea productivity (production per unit of area) the highest?
- 1996
- 1997
- 1998
- 1999
Answers
- B
- A
- D
Ratio of export of tea to the production of tea was highest in 1997.