Each point in the graph below shows the profit and turnover data
Each point in the graph below shows the profit and turnover data for a company. Each company belongs to one of the three industries: textile, cement and steel.
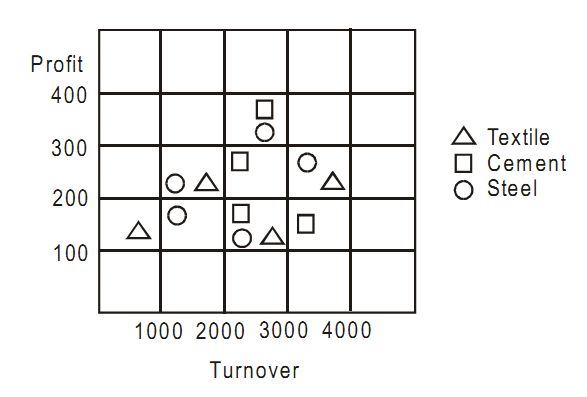
1. For how many companies does the profit exceed 10% of turnover?
- 5
- 6
- 7
- 8
2. For how many steel companies with a turnover of more than 2000 is the profit than 300?
- 0
- 1
- 2
- 7
3. An investor wants to buy stock of only steel or cement companies with a turnover more than 1000 and profit exceeding 10% of turnover. How many choices are available to the investor?
- 4
- 5
- 6
- 7
Answers
- C
- C
- B