The table below provides certain demographic details
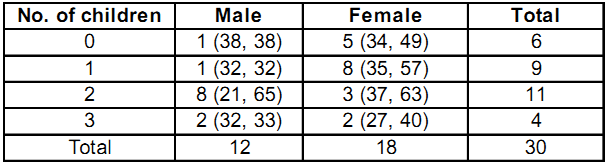
The table below provides certain demographic details of 30 respondents who were part of a survey. The demographic characteristics are: gender, number of children, and age of respondents. The first number in each cell is the number of respondents in that group. The minimum and maximum age of respondents in each group is given in brackets. For example, there are five female respondents with no children and among these five, the youngest is 34 years old, while the oldest is 49.
1. The percentage of respondents aged less than 40 years is at least
- 10%
- 20%
- 30%
- 16.67%
2. Given the information above, the percentage of respondents older than 35 can be at most
- 30%
- 73.33%
- 76.67%
- 90%
3. The percentage of respondents that fall into the 35 to 40 years age group (both inclusive) is at least
- 6.67%
- 10%
- 13.33%
- 26.67%
Answers
- C
- C
- C
1. When maximum age is less than 40 years, add total number of respondents. When maximum age is more than 40 years, assume 1 respondent to be less than 40 years (minimum age), and rest above 40 years. So add 1 from this to total.