Tables
Tables
Expenditures of a company per year over the given years
Expenditures of a company (in lakh rupees) per year over the given years:
| Year | Item of Expenditure | ||||
| Salary | Transport | Bonus | Interest on Loan | Taxes | |
| 2008 | 288 | 98 | 3.00 | 23.4 | 83 |
| 2009 | 342 | 112 | 2.52 | 32.5 | 108 |
| 2010 | 324 | 101 | 3.84 | 41.6 | 74 |
| 2011 | 336 | 133 | 3.68 | 36.4 | 88 |
| 2012 | 420 | 142 | 3.96 | 49.4 | 98 |
1. What is the average amount of interest per year which the company had to pay during this period?
- Rs. 34.18 lakhs
- Rs. 36.66 lakhs
- Rs. 33.72 lakhs
- Rs. 32.43 lakhs
2. The total amount of bonus paid by the company during the given period is approximately what percent of the total amount of salary paid during this period?
- 1%
- 1.25%
- 0.5%
- 0.1%
The table below provides certain demographic details
The table below provides certain demographic details of 30 respondents who were part of a survey. The demographic characteristics are: gender, number of children, and age of respondents. The first number in each cell is the number of respondents in that group. The minimum and maximum age of respondents in each group is given in brackets. For example, there are five female respondents with no children and among these five, the youngest is 34 years old, while the oldest is 49.
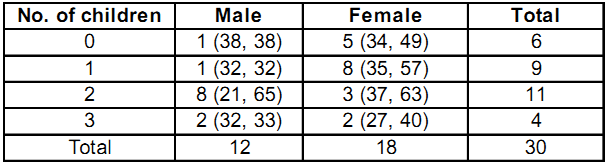
1. The percentage of respondents aged less than 40 years is at least
- 10%
- 20%
- 30%
- 16.67%
2. Given the information above, the percentage of respondents older than 35 can be at most
- 30%
- 73.33%
- 76.67%
- 90%
3. The percentage of respondents that fall into the 35 to 40 years age group (both inclusive) is at least
- 6.67%
- 10%
- 13.33%
- 26.67%
Spam that enters our electronic mailboxes can be classified
Spam that enters our electronic mailboxes can be classified under several spam heads. The following table shows the distribution of such spam worldwide over time. The total number of spam emails received during December 2002 was larger than the number received in June 2003. The total number of spam emails received during September 2002 was larger than the number received in March 2003. The figures in the table represent the percentage of all spam emails received during that period, falling into those respective categories.
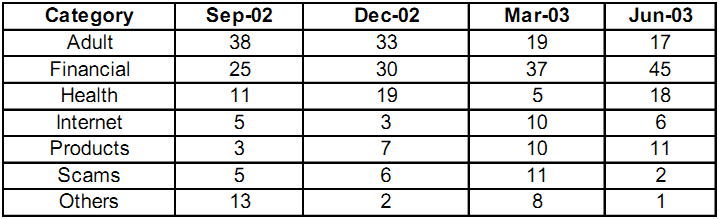
1. In which category was the percentage of spam emails increasing but at a decreasing rate?
- Scams
- Financial
- Products
- Internet
2. In the health category, the number of spam emails received in December 2002 as compared to June 2003.
- was smaller
- was larger
- was equal
- cannot be determined
3. In the financial category, the number of spam emails received in September 2002 as compared to March 2003.
- was larger
- was smaller
- was equal
- cannot be determined
Abdul has 8 factories, with different capacities, producing boutique kurtas
Study the paragraph below and answer the questions that follow:
Abdul has 8 factories, with different capacities, producing boutique kurtas. In the production process, he incurs raw material cost, selling cost (for packaging and transportation) and labour cost. These costs per kurta vary across factories. In all these factories, a worker takes 2 hours to produce a kurta. Profit per kurta is calculated by deducting raw material cost, selling cost and labour cost from the selling price (Profit = selling price - raw materials cost - selling cost - labour cost). Any other cost can be ignored.
Exhibit: Business Details of Abdul's 8 Factories

1. Which of the following options is in decreasing order of raw materials cost?
- Factory 3, Factory 4, Factory 7, Factory 5
- Factory 4, Factory 3, Factory 2, Factory 5
- Factory 6, Factory 3, Factory 5, Factory 7
- Factory 6, Factory 8, Factory 7, Factory 2
- Factory 8, Factory 3, Factory 2, Factory 4
2. Which of the factories listed in the options below has the lowest sales margin (sales margin = profit per kurta divided by selling price per kurta)?
- Factory 2
- Factory 4
- Factory 5
- Factory 6
- Factory 7
In a country called XYZ, the number of patients changes every year
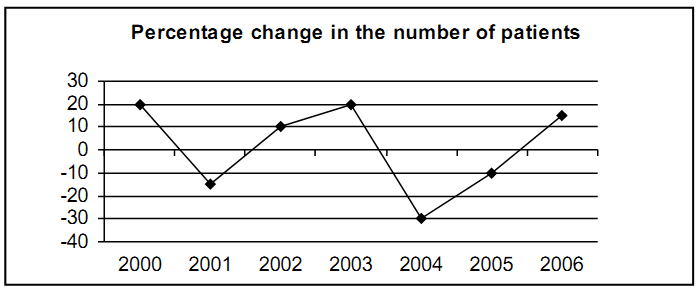
In a country called XYZ, the number of patients changes every year. The graph given below shows the percentage change in the number of patients w.r.t. the previous year. The table given below shows the number of hospitals available in XYZ. The number of patients in 1999 were 2,00,000.
| Year | Number of Hospitals |
| 2000 | 4700 |
| 2001 | 4850 |
| 2002 | 5100 |
| 2003 | 5200 |
| 2004 | 5350 |
| 2005 | 5500 |
| 2006 | 5700 |
1. Find the year for which the Unhealthiness Index of XYZ was the maximum
- 2000
- 2003
- 2004
- 2006
2. In 2006, WHO launched a massive health improvement program in XYZ. As a result there was 30% reduction in the number of patients per year for the next two years and the number of hospitals in the country was also increased by 10% per year during the same period. Find the un-healthiness Index of XYZ for the year 2008.
- 21.3
- 15.4
- 19.8
- 13.9
3. The Government of XYZ targets an Unhealthiness Index of 15 for the year 2007. By approximately what percent should the number of hospitals be increased in 2007 over the previous year if the number of patients in 2007 is expected to decrease by 40% over the previous year?
- 37%
- 34%
- 27%
- 47%