Consider the graph in which the birthrate and death rate of a country
Consider the following graph in which the birthrate and death rate of a country are given, and answer the two items that follow.
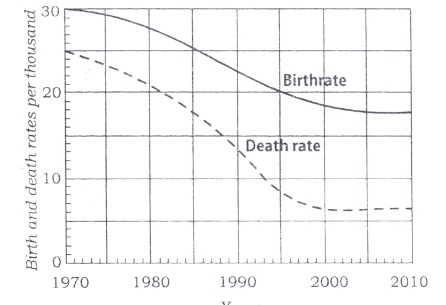
1. Looking at the graph, it can be inferred that from 1990 to 2010
- population growth rate has increased
- population growth rate has decreased
- growth rate of population has remained stable
- population growth rate shows no trend
2. With reference to the above graph, consider the following statements considering 1970 as base year:
- Population has stabilized after 35 years.
- Population growth rate has stabilized after 35 years.
- Death rate has fallen by 10% in the first 10 years.
- Birthrate has stabilized after 35 years.
Which of the above are the most logical and rational statements that can be made from the above graph?
- 1 and 2 only
- 1, 2 and 3
- 3 and 4
- 2 and 4
Answers
- B
- A
Population growth rate = birth rate - death rate
From 1990 to 2010, birth rate is decreasing and death rate is almost constant. So, population growth rate is decreasing.